Ở bài học IELTS Writing Unit 1: Tổng quan về Writing Task 1, cô đã giới thiệu với các bạn cấu trúc bài viết bao gồm 3 phần là introduction, overview, và body. Vậy thì, bài học Unit 2 hôm nay, cô cung cấp tài liệu giúp các bạn chọn lọc thông tin để đưa vào phần overview và body dễ dàng hơn.
Nào, chúng ta bắt đầu thôi. Bạn xem lại bài học Tổng quan về Writing Task 1
HƯỚNG DẪN CÁCH VIẾT LINE GRAPH VÀ BẢNG BIỂU
Các bạn cùng theo dõi hướng dẫn theo video sau:
II. KIẾN THỨC HỌC TẬP
1. Các dạng biểu đồ hay gặp
Các dạng biểu đồ đều có một đặc điểm chung, chúng đều đại diện cho các con số. Nhiệm vụ của bạn là phải mô tả lại các con số đó.
Có bốn loại biểu đồ bạn cần phải mô tả:
Biểu đồ đường (Line graph)
Biểu đồ tròn (Pie chart)

Biểu đồ cột (Bar graph)
Bảng (Tables)

2. Cách lựa chọn những thông tin chính
a. Lựa chọn thông tin cho phần overview
Trong phần này, giám khảo muốn đánh giá khả năng chọn lọc những điểm nổi bật nhất xuất hiện trong biểu đồ. Những đặc điểm này bao gồm:
– Đặc điểm về xu hướng: tăng hay giảm?
– Đặc điểm về độ lớn: cao nhất? thấp nhất? thay đổi nhiều nhất?
Lưu ý: Không đưa số liệu cụ thể!
Ví dụ:
Internet Users as Percentage of Population

Xu hướng:
– Đặc điểm về xu hướng: số người sử dụng Internet đều tăng ở các quốc gia
– Đặc điểm về độ lớn: Canada và USA là hai nước có người sử dụng Internet lớn hơn so với Mexico, trong đó ở Canada là nhiều nhất.
Sample Overview:
It is clear that the proportion of the population who used the Internet increased in each country over the period shown. Overall, a much larger percentage of Canadians and Americans had access to the Internet in comparison with Mexicans, and Canada experienced the fastest growth in Internet usage. (Nguồn: ielts-simon.com)
b. Lựa chọn thông tin cho phần Body
Phần lớn các thí sinh khi đi thi đều cảm thấy khó khăn khi phải chọn ra thông tin cần thiết để viết vào bài. Vì vậy, các bạn cần phải biết lựa chọn ưu tiên. Đề bài yêu cầu chúng ta “select main features” – chọn ra những đặc điểm chính. Do đó, chung ta cần chọn ra 2-3 đặc điểm nổi bật và tập trung mô tả những đặc điểm đó.
Những chi tiết mà ta cần đưa vào trong bài đó là:
– High/low values – giá trị cao nhất/thấp nhất
– Erratic values – giá trị bất thường
– Biggest increase/decrease – tăng giảm nhiều nhất
– Volatile data – các số liệu biến động
– Unchanging data – các số liệu không thay đổi
– Biggest majority/minority – phần lớn nhất/nhỏ nhất (biểu đồ tròn)
– Major trends – các xu hướng chính
– Notable exceptions – những trường hợp ngoại lệ đáng lưu ý
Ví dụ:
Internet users as Percentage of Population

Đặc điểm chính:
– Giá trị thấp nhất: Vào năm 1999, số lượng người dùng internet ở cả ba nước đều thấp, ở Mỹ là 20%, Canada và Mexico thấp hơn với tỉ lệ lần lượt là 10% và 5%.
– Xu hướng chính tăng lên: Đến năm 2005, lượng người dùng tang lên ở cả 3 nước, mở Mỹ và Canada chiếm 70% dân số, trong đó ở Mexico chiếm 25%
– Giá trị cao nhất: Đến năm 2009, số người dùng Internet của Canada chiếm 90% dân số, trong khi ở Mỹ và Mexico là 80% và 40%
Sample Body:
In 1999, the proportion of people using the Internet in the USA was about 20%. The figures for Canada and Mexico were lower, at about 10% and 5% respectively. In 2005, Internet usage in both the USA and Canada rose to around 70% of the population, while the figure for Mexico reached just over 25%.
By 2009, the percentage of Internet users was highest in Canada. Almost 100% of Canadians used the Internet, compared to about 80% of Americans and only 40% of Mexicans. (Nguồn: ielts-simon.com)
Tips for table!
Đối với dạng bài có liên quan đến bảng, các thí sinh thường gặp khó khăn hơn trong việc đưa ra thông tin chính bởi bảng chứa rất nhiều con số. Dưới đây là một số tips giúp các bạn giải quyết các bài về bảng:
– Trước khi viết, hãy tìm ra những con số nổi bật, hãy chọn ra số lớn nhất của mỗi tiêu chí trong bảng (ví dụ ở mỗi cột, mỗi hàng)
– Nếu trong bảng có đề cập về thời gian, tìm ra con số lớn nhất qua các năm
– Trong phần overview, phân tích và so sánh các tiêu chí theo các hàng và cột
– Trong phần body, các bạn không bao giờ được mô tả từng tiêu chí mà hãy chọn số liệu lớn nhất và thấp nhất ở từng tiêu chí và so sánh chúng với nhau.
Ví dụ:
The table below gives information on consumer spending on different items in five different countries in 2002.
Percentage of national consumer expenditure by category – 2002

Overview:
– Food/Drinks/Tobacco là lĩnh vực có lượng chi tiêu cao nhất
– Leisure/Educatin là lĩnh vực có lượng chi tiêu thấp nhất
Sample overview:
It is clear that the largest proportion of consumer spending in each country went on food, drinks and tobacco. On the other hand, the leisure/education category has the lowest percentages in the table. (Nguồn: ielts-simon.com)
Body:
– Ireland và Turkey hai nước có lượng chi tiêu trong lĩnh vực food/drinks/tobacco nhiều nhất. Turkey cũng là nước dẫn đầu về chi tiêu trong lĩnh vực leisure/education trong khi Italy là nước dẫn đầu về chi tiêu trong lĩnh vưc clothing/footwear.
– Sweden là nước có chi tiêu thấp nhất trong hai lĩnh vực food/drinks/tobacco và clothing/footwear. Spain là nước có chi tiêu thấp nhất về leisure/eduction.
Body Sample:
Out of the five countries, consumer spending on food, drinks and tobacco was noticeably higher in Turkey, at 32.14%, and Ireland, at nearly 29%. The proportion of spending on leisure and education was also highest in Turkey, at 4.35%, while expenditure on clothing and footwear was significantly higher in Italy, at 9%, than in any of the other countries.
It can be seen that Sweden had the lowest percentages of national consumer expenditure for food/drinks/tobacco and for clothing/footwear, at nearly 16% and just over 5% respectively. Spain had slightly higher figures for these categories, but the lowest figure for leisure/education, at only 1.98%. (Nguồn: ielts-simon.com).
3. Dạng khác: Biểu đồ kết hợp
Một dạng biểu đồ khác mà ta hay gặp trong Writing Task 1, đó chính là dạng biểu đồ kết hợp, dạng bài có nhiều hơn một biếu đồ.

i. NHỮNG LỖI THƯỜNG GẶP KHI LÀM DẠNG BÀI BIỂU ĐỒ KẾT HỢP
– Viết quá nhiều thông tin
Cách khắc phục: chọn ra hai đặc điểm nổi bật nhất từ mỗi biểu đồ và chỉ tập trung mô tả về hai điểm đó. Vì đề bài yêu cầu “summerise” – tóm tắt và “report main features” – báo cáo những ý chính , do đó việc chúng ta viết hết các thông tin là sai.
– Không thể tìm thấy các điểm nổi bật
Cách khắc phục: nhìn vào hình ảnh mà không cần nhìn vào số liệu. Ngoài ra các bạn cũng nên tìm ra các giá trị lớn nhất, nhỏ nhất, xu hướng, thay đổi chính, và so sánh giữa hai biểu đồ hoặc trong cùng một biểu đồ.
– So sánh không đúng chỗ
Cách khắc phục: Nếu như không tìm thấy một sự so sánh nổi bật nào giữa hai biểu đồ, bạn hoàn toàn có thể bỏ qua. Và lưu ý rằng chúng ta có thể so sánh số liệu trong cùng một biểu đồ.
ii. TIPS LÀM BÀI BIỂU ĐỒ KẾT HỢP
1. Cấu trúc làm bài bao gồm: introduction, overview, và chia hai đoạn body dành cho mỗi biểu đồ
2. Nếu như đơn vị khác nhau chúng ta không nên so sánh
3. Nếu có cùng đơn vị chúng ta có thể so sánh
5. Nếu có nhiều hơn hai biểu đồ, ta có thể so sánh các biểu đồ
Ví dụ:
The charts below give information about USA marriage and divorce rates between 1970 and 2000, and the marital status of adult Americans in two of the years.
Summarise the information by selecting and reporting the main features, and make comparisons where relevant.

Sample Answer:
The first bar chart shows changes in the number of marriages and divorces in the USA, and the second chart shows figures for the marital status of American adults in 1970 and 2000.
It is clear that there was a fall in the number of marriages in the USA between 1970 and 2000. The majority of adult Americans were married in both years, but the proportion of single adults was higher in 2000.
In 1970, there were 2.5 million marriages in the USA and 1 million divorces. The marriage rate remained stable in 1980, but fell to 2 million by the year 2000. In contrast, the divorce rate peaked in 1980, at nearly 1.5 million divorces, before falling back to 1 million at the end of the period.
Around 70% of American adults were married in 1970, but this figure dropped to just under 60% by 2000. At the same time, the proportion of unmarried people and divorcees rose by about 10% in total. The proportion of widowed Americans was slightly lower in 2000. (Nguồn: ielts-simon.com)
III. NỀN TẢNG NGỮ PHÁP
1. Từ vựng miêu tả xu hướng
Xu hướng Verb Noun Tăng • Rise• Increase• Grow• Climb• Go up • A rise• An increase• A growth• A climb• An upward trend Giảm • Fall• Decrease• Reduce• Decline• Go down• Drop • A fall• A decrease• A reduction• A decline• A downward trend• A drop Duy trì ở mức ổn định • Remain stable/ steady• Stabilize• Stay stable/ unchanged • Stability Dao động • Fluctuate• Be volatile • A fluctuation• A volatility Đạt mức cao nhất • Hit the highest point• Reach a peak Đạt mức thấp nhất • Hit the lowest point
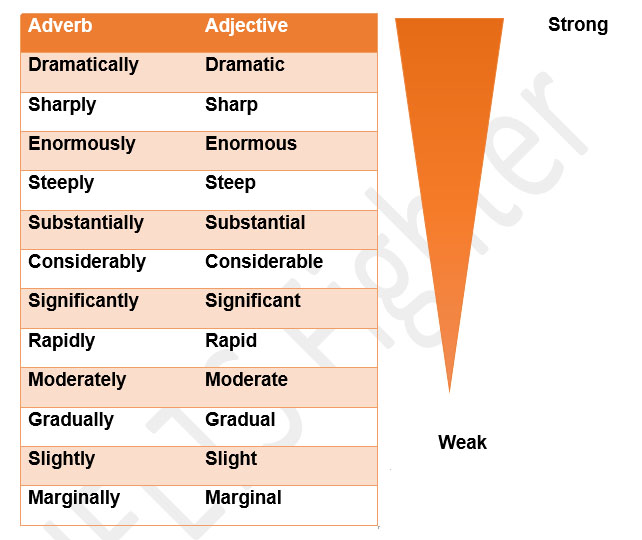
2. Từ vựng miêu tả tốc độ mức độ thay đổi
3. Cấu trúc câu mô tả sự thay đổi
Cấu trúc Ví dụ S + v + adv + number + time period GM car sales increased significantly from $5,000 to $105,000 between 1960 and 2010 There be + a/an + adj + noun + number + in + s + time period There was a significant increase of $100,000 in GM car sales, from $5,000 to $105,000, between 1960 and 2010. S + experienced/ saw + a/an +noun + number + time period GM car sales saw a significant growth in GM car sales, from $5,000 to $105,000, between 1960 and 2010.
4. Cấu trúc câu so sánh
Cấu trúc
Ví dụ
Compared to/with
Prices in the UK are high compared to/with prices in Canada and Australia.
In comparison to/with
Prices in the UK are high in comparison to/ with prices in Canada and Australia
While/ Whereas/Although
There are 5 million smokers in the UK, while / whereas only 2 million Canadians and 1 million Australians smoke.
Between 1990 and 2000, the number of smokers in the UK decreased dramatically, while / whereas the figures for Canada and Australia remained the same.
Although the Middle East produced 100 tons oil, Japan produced none.
However/In contrast/ On the other hand
The Middle East produces high levels of oil; however, Japan produces none.
The USA produces large amounts of natural gas. In contrast, South Korea produces none.
European countries make great use of solar power. On the other hand, most Asian countries us this method of power generation very little.
5. Các cấu trúc so sánh khác
- Developing countries are more reliant on alternative energy production than developed countries.
- Solar power accounts for far less of the total energy production than gas or coal does.
- Hydropower is not as efficient as wind power.
- Like Japan, South Korea does not produce any natural gas.
- The Middle East produces twice as much oil as
- Western countries consume three times more oil than the Middle East.
- Russia consumes slightly more oil than Germany.
- The UAE produced the same amount of oil as Saudi Arabia.
6. Cách sử dụng giới từ
Khi mô tả số liệu và các đặc điểm, các giới từ như “to”, “by”, “with”, và “at” có vai trò rất quan trọng trong câu. Dưới đây là cách sử dụng các giới từ này trong bài viết, các bạn cùng tham khảo nhé:
- Dùng giới từ “to” khi mô tả sự thay đổi đến mức nào đó
Ví dụ: In 2018, the rate of unemployment rose to 10%
- Dùng giới từ “by” khi mô tả sự thay đổi một khoảng nào đó
Ví dụ: In 2009, the rate of unemployment fell by 2% (from 10% to 8%)
- Dùng giới từ “with” để mô tả phần trăm, số lượng chiếm được
Ví dụ: He won’t the election with 52% of the vote
- Dùng giới từ “at” để thêm con số vào cuối câu
Ví dụ: Unemployment reached its highest point in 2008, at 10%.
IV. BÀI TẬP
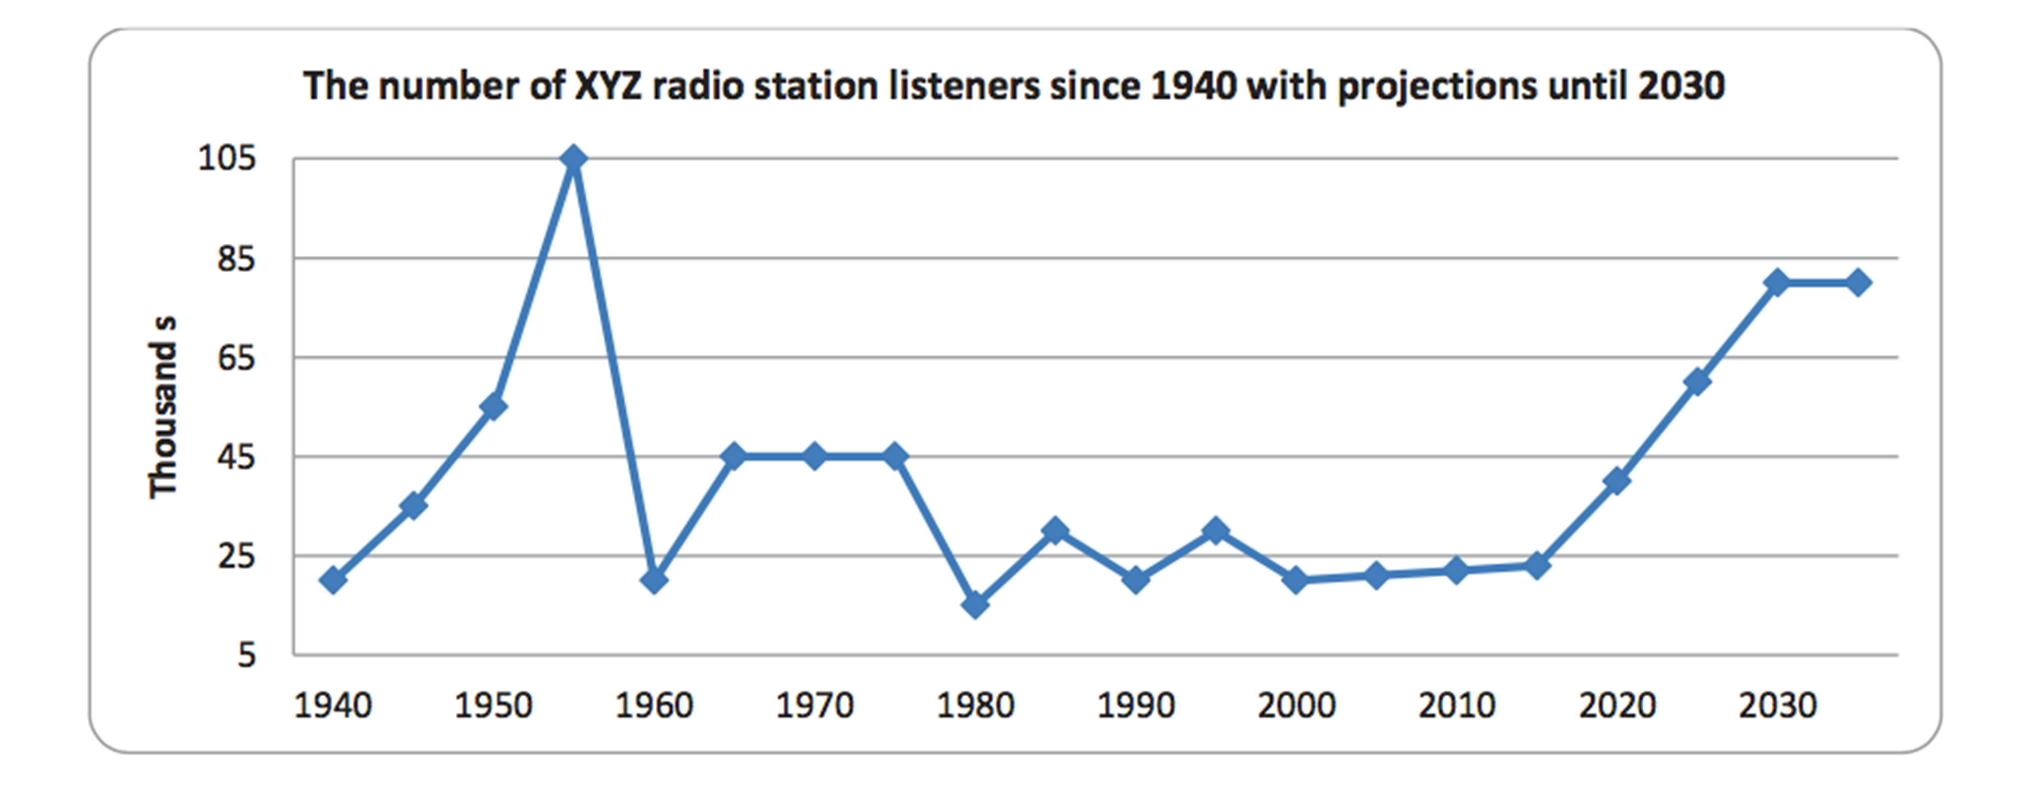
1. Nhìn vào biểu đồ dưới đây và mô tả sự thay đổi sử dụng các từ và cụm từ sau:
- mild fluctuations
- a peak
- a period of instability
- a significant increase
- a partial growth
- a record high
- figures climbing back
- a marked rise
- a dramatic decrease
- a period of slight volatility
- a leveling out
- a sharp decline
- a plateau
- figures remaining constant
2. Hoàn thành các câu sau sử dụng giới từ phù hợp:
For, At, On, To, In, By, From, Between, Of, Up, Down, With, And, During
1. ……… 1990 ……… 2000, there was a drop ……… 15%. 2. GM car sales peaked ……… 2,000 in 1999. 3. The chart shows a decline ……… 35% ……… the bird population. 4. There has been a significant increase ……… the number of people aged over eighty. 5. There have been dramatic cuts ……… the level of spending on the elderly, reaching a low …… 11%. 6. Profits rose ……… a low of 4.5 million to a high of 8 million in 2008. 7. Canada and Australia’s wheat exports fluctuated ……… 5 million and 6 million respectively. 8. There were significant improvements ……… healthcare ……… 1980. 9. The statistics show a reduction ……… 20% ……… energy costs as a result ……… the measures. 10. Profits fell ……… 10%, from 2,000 to 1,800 in 1970s. 11. The radio station experienced a fall ……… 36,000 listeners to a total audience ……… 2.1 million. 12. The number of students fell ……… a low of 1,500 in the second half of the year. 13. Cases of AIDS shot ……… from 2,400 in 1996 to 4,000 in 2004. 14. Demand reached a peak ……… 45,000 in early March. 15. The number of cars sold remained unchanged in 1999 ……… three million. 16. Students do between three ……… four hours homework a night. 17. The number of accidents ……… 1999 was slightly higher than that of 2000. 18. The figure rose steadily ……… the four years between 1997 ……… 2001. 19. Oil production rose dramatically at first but then leveled out ……… $70 a barrel. 20. There was an increase ……… 50,000 between 1990 and 1992. 21. ……… 1994 ……… 1997, sales rose steadily ……… over 20,000. 22. DVD sales peaked ……… 60,000 ……… 1992 but then decreased ……… about 10,000 over the next two years. 23. In the year 2000, sales started ……… 10,000. In the first month, there was a rise ……… around 2,000. 24. After some fluctuations, sales in 2000 reached their peak ……… just over 15,000, a rise ……… 5,000 since the beginning of the year. Sales increased ……… over 10,000 between 1994 and 1997, but then dropped ……… more than 10,000 …………… 1997 and 1999. 25. In 2008, the rate of unemployment rose …… 10%. 26. In 2008, the rate of unemployment rose …… 10%, from 2,000 to 2,200 cases. 27.There was a slight rise …… the number of men employed. 28. Experts expect there to be a fall …… approximately 30% over the next decade. 29. The introduction ……… DVDs led to a decline ……… 20% ……… video sales. 30. The figures show a drop ……… 5% ……… student numbers. 31. The health service program spent a total ……… $2.5 billion on staffing …… April 2002. 32. The survey hopes to track trends ……… consumer spending. 33. In 2009, the rate of unemployment fell ……… 2% (from 10% to 8%). 34. He won the election ……… 52% of the vote. 35. Unemployment reached its highest level ……… the year 2008 ……… 10%. 36. ……… 2002, the cost of an average house in the UK was around £130,000. ……… 2007, the average house price had risen ……… almost £190,000, but it fell back ……… just under £150,000 ……… 2008. 37. Japan ……… two gold medals and a silver one stood ahead of the US ……… one gold and one bronze medal ……… 1968.
(Tài liệu có tham khảo từ ielts-simon.com)
Vậy là chúng ta đã hiểu rõ hơn về các dạng bài Line graph – Pie chart – Bar graph – Tables trong IELTS Writing Task 1. Để biết rõ hơn cách viết dạng Map thì các bạn theo dõi ở link.


